06:02 | 29/05/2022
![]()
 << Countries around the world >>
![]()
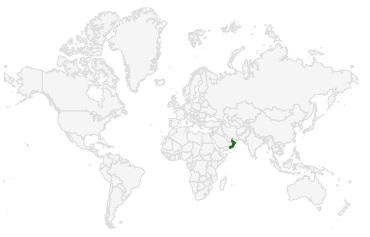
Oman. Population: 5,367,852. Land area is 309,500 Km2 (119,499 sq. miles). Capital: Muscat
![]()
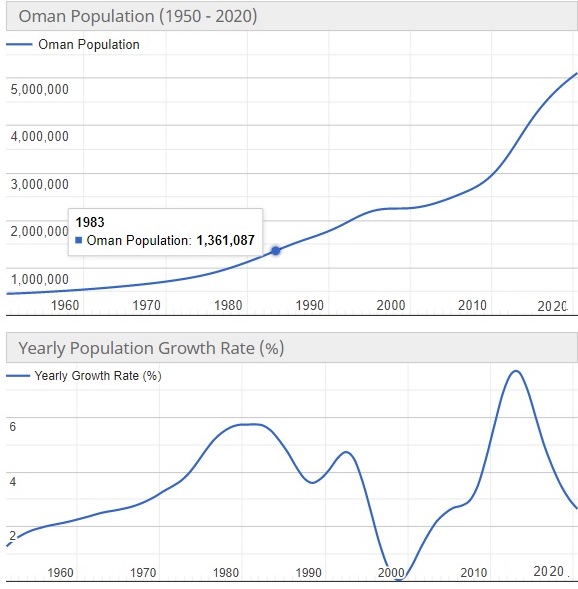
- The current population of Oman is 5,353,038 as of Saturday, May 28, 2022, based on Worldometer elaboration of the latest United Nations data.
- Oman 2020 population is estimated at 5,106,626 people at mid year according to UN data.
- Oman population is equivalent to 0.07% of the total world population.
- Oman ranks number 120 in the list of countries (and dependencies) by population.
- The population density in Oman is 16 per Km2 (43 people per mi2).
- The total land area is 309,500 Km2 (119,499 sq. miles)
- 87.0 % of the population is urban (4,442,970 people in 2020)
- The median age in Oman is 30.6 years.
![]()
Population of Oman (2020 and historical)
| Year | Population | Yearly% Change |
Yearly Change |
Migrants (net) | Median Age | Fertility Rate | Density (P/Km²) | Urban Pop% |
Urban Population | World Population | Global Rank |
|---|---|---|---|---|---|---|---|---|---|---|---|
| 2020 | 5,106,626 | 2.65 % | 131,640 | 87,400 | 30.6 | 2.93 | 16 | 87.0% | 4,442,970 | 7,794,798,739 | 120 |
| 2019 | 4,974,986 | 3.01 % | 145,513 | 87,400 | 29.3 | 2.91 | 16 | 85.9% | 4,273,762 | 7,713,468,100 | 122 |
| 2018 | 4,829,473 | 3.51 % | 163,545 | 87,400 | 29.3 | 2.91 | 16 | 84.5% | 4,083,206 | 7,631,091,040 | 122 |
| 2017 | 4,665,928 | 4.17 % | 186,709 | 87,400 | 29.3 | 2.91 | 15 | 83.0% | 3,874,042 | 7,547,858,925 | 125 |
| 2016 | 4,479,219 | 4.96 % | 211,871 | 87,400 | 29.3 | 2.91 | 14 | 81.5% | 3,650,429 | 7,464,022,049 | 126 |
| 2015 | 4,267,348 | 7.01 % | 245,183 | 177,156 | 29.0 | 2.90 | 14 | 80.1% | 3,416,565 | 7,379,797,139 | 126 |
| 2010 | 3,041,434 | 3.91 % | 106,037 | 53,400 | 26.2 | 2.90 | 10 | 75.2% | 2,285,997 | 6,956,823,603 | 136 |
| 2005 | 2,511,251 | 2.06 % | 48,656 | 3,000 | 22.9 | 3.20 | 8 | 72.4% | 1,818,164 | 6,541,907,027 | 140 |
| 2000 | 2,267,973 | 0.57 % | 12,739 | -38,674 | 20.9 | 4.46 | 7 | 71.6% | 1,623,172 | 6,143,493,823 | 141 |
| 1995 | 2,204,277 | 4.00 % | 78,423 | 20,940 | 20.9 | 6.27 | 7 | 71.7% | 1,579,777 | 5,744,212,979 | 139 |
| 1990 | 1,812,161 | 3.88 % | 62,749 | 2,234 | 17.9 | 7.85 | 6 | 66.1% | 1,197,883 | 5,327,231,061 | 144 |
| 1985 | 1,498,418 | 5.36 % | 68,808 | 16,300 | 17.5 | 8.32 | 5 | 57.1% | 855,282 | 4,870,921,740 | 145 |
| 1980 | 1,154,377 | 5.53 % | 54,466 | 15,282 | 17.6 | 8.10 | 4 | 47.6% | 549,043 | 4,458,003,514 | 145 |
| 1975 | 882,047 | 4.03 % | 31,639 | 5,094 | 17.1 | 7.41 | 3 | 38.2% | 337,059 | 4,079,480,606 | 148 |
| 1970 | 723,851 | 2.98 % | 19,768 | -1,000 | 16.9 | 7.31 | 2 | 29.7% | 214,732 | 3,700,437,046 | 148 |
| 1965 | 625,009 | 2.53 % | 14,654 | -2,000 | 17.4 | 7.25 | 2 | 22.3% | 139,614 | 3,339,583,597 | 149 |
| 1960 | 551,740 | 2.16 % | 11,184 | -2,000 | 18.0 | 7.25 | 2 | 16.4% | 90,485 | 3,034,949,748 | 150 |
| 1955 | 495,818 | 1.67 % | 7,880 | -2,000 | 18.5 | 7.25 | 2 | 12.0% | 59,302 | 2,773,019,936 | 149 |
![]()
Oman Population Forecast
| Year | Population | Yearly% Change |
Yearly Change |
Migrants (net) | Median Age | Fertility Rate | Density (P/Km²) | Urban Pop% |
Urban Population | World Population | Global Rank |
|---|---|---|---|---|---|---|---|---|---|---|---|
| 2020 | 5,106,626 | 3.66 % | 167,856 | 87,400 | 30.6 | 2.93 | 16 | 87.0% | 4,442,970 | 7,794,798,739 | 120 |
| 2025 | 5,573,005 | 1.76 % | 93,276 | 22,000 | 32.1 | 2.93 | 18 | 89.5% | 4,989,686 | 8,184,437,460 | 121 |
| 2030 | 5,936,081 | 1.27 % | 72,615 | 12,000 | 33.7 | 2.93 | 19 | 91.1% | 5,407,224 | 8,548,487,400 | 119 |
| 2035 | 6,196,675 | 0.86 % | 52,119 | 0 | 34.9 | 2.93 | 20 | 92.0% | 5,703,283 | 8,887,524,213 | 120 |
| 2040 | 6,437,418 | 0.77 % | 48,149 | 0 | 35.5 | 2.93 | 21 | 92.5% | 5,956,398 | 9,198,847,240 | 118 |
| 2045 | 66,671,91 | 0.72 % | 46,900 | 0 | 36.6 | 2.93 | 22 | 92.7% | 6,183,679 | 9,481,803,274 | 117 |
| 2050 | 6,915,444 | 0.72 % | 48,706 | 38.4 | 2.93 | 22 | 92.7% | 6,409,863 | 9,735,033,990 | 117 |
![]()
Main Cities by Population in Oman
| # | CITY NAME | POPULATION | ||
|---|---|---|---|---|
| 1 | Muscat | 797,000 | ||
| 2 | Seeb | 237,816 | ||
| 3 | Salalah | 163,140 | ||
| 4 | Bawshar | 159,487 | ||
| 5 | Sohar | 108,274 | ||
| 6 | As Suwayq | 107,143 | ||
| 7 | `Ibri | 101,640 | ||
| 8 | Saham | 89,327 | ||
| 9 | Barka’ | 81,647 | ||
| 10 | Rustaq | 79,383 | ||
| 11 | Al Buraymi | 73,670 | ||
| 12 | Nizwa | 72,076 | ||
| 13 | Sur | 71,152 | ||
| 14 | Bahla’ | 54,338 | ||
| 15 | Al Khaburah | 50,223 | ||
| 16 | Shinas | 48,009 | ||
| 17 | Sufalat Sama’il | 47,718 | ||
| 18 | Izki | 36,203 | ||
| 19 | Liwa | 26,372 | ||
| 20 | Ibra’ | 25,265 | ||
| 21 | Oman Smart Future City | 25,000 | ||
| 22 | Bidbid | 21,188 | ||
| 23 | Badiyah | 18,479 | ||
| 24 | Khasab | 17,904 | ||
| 25 | Adam | 17,283 | ||
| 26 | Yanqul | 16,599 |
![]()

Related Posts